
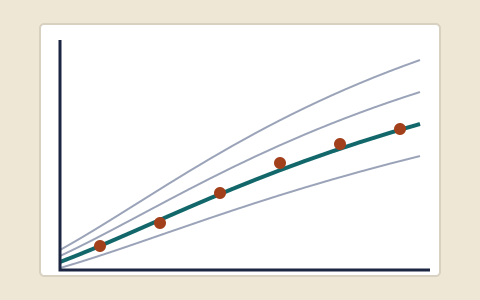
Growth charts are one of the main ways a child's growth is checked, and they are also a common source of worry. A parent hears "25th percentile" and wonders whether their child is behind. This guide explains what the curves mean, which charts are used at which ages, and why one number on its own says much less than the pattern over time.
What a growth chart is
The U.S. Centers for Disease Control and Prevention (CDC) describes growth charts as a series of percentile curves that show the distribution of selected body measurements, such as height and weight, in children. Paediatricians, nurses and parents in the United States have used them to track the growth of infants, children and adolescents since 1977.
A chart has age along the bottom and the measurement, such as height, up the side. Instead of one line showing "normal", it has a set of curved lines. Each line traces where a given share of children of that age and sex fall. Separate charts are used for boys and girls, because they grow on different timetables.
The CDC is careful to say what growth charts are not. They are not meant to be used as the only tool for diagnosing anything. They are one input that helps a clinician form an overall picture of the child being measured, alongside an examination, the child's history and anything else that seems relevant.
What a percentile means
A percentile is a position in a ranked group. If a child's height is on the 25th percentile line, it means that, in the reference group used to build the chart, about 25 out of every 100 children of the same age and sex were shorter, and about 75 were taller. A child on the 50th percentile is in the middle. A child on the 90th is taller than about 90 in 100.
Every percentile line on a standard chart describes healthy children. Someone has to be on the 10th percentile and someone has to be on the 90th; that is simply how a spread of heights works. Being near the top or bottom of the range is not, by itself, a diagnosis of anything.
Example (invented for illustration)
A child is measured at their yearly check-ups at ages 4, 5, 6 and 7. Each time, their height lands close to the 20th percentile line. They are shorter than most children their age, but they are growing steadily along the same curve. A doctor would generally read that as a consistent pattern, often one that matches the family, rather than a problem in itself.
Which chart is used at which age
In the United States, the CDC recommends different charts for different ages. For babies and children from birth to 2 years, it uses the World Health Organization (WHO) growth standards. The CDC explains that the WHO released these standards in 2006. They describe how children aged 0 to 59 months grew in six countries, including the United States, in environments that WHO researchers considered to support optimal growth. In other words, they show how young children grow when conditions are good, rather than describing an average that includes children growing up in poor conditions.
From age 2, the CDC's own growth charts are used. MedlinePlus lists the CDC's stature-for-age percentile charts for boys and for girls covering ages 2 to 20 years.
Why the trend matters more than one point
A single measurement is a snapshot. It can be thrown off by a child slouching, wearing thick socks, or simply by the normal small errors of measuring. What carries more information is a series of measurements over months and years, plotted on the same chart.
The pattern doctors look for is whether a child keeps following roughly the same curve. MedlinePlus lists a slowed growth rate compared with children of the same age and sex as one of the signs of growth hormone deficiency, and says that very slow or very fast growth can sometimes signal a gland problem. The NHS advises seeing a GP if a child is not growing as expected for their age. All three point the same way: the question is less "where is my child on the chart?" and more "is my child keeping to their line?"
Timing also complicates the picture in the teenage years. NICHD and MedlinePlus describe puberty as starting anywhere from about 8 to 13 in girls and 9 to 14 in boys, with a growth spurt of two or three years. Two healthy 12-year-olds can therefore be at very different points in their growth. That is one reason the CDC says a chart contributes to a clinical impression rather than deciding anything on its own.
In one line
A steady line on any percentile is usually more reassuring than a single high number; a line that drifts sharply down or up over time is worth asking about.
A percentile is not a grade
It is easy to read percentiles like test results, where higher is better. For height they are not. A child on the 15th percentile who is healthy and growing steadily is doing exactly what their body is meant to do. Genes account for most of the difference in height between people, as the guide on what determines height explains, so children of shorter parents will often sit lower on the chart.
This matters because a low percentile can push parents and teenagers towards products that promise to "boost" growth. Those promises have no support in the sources this site relies on; the guide on height myths looks at them in detail. The useful response to a low percentile is to look at the trend and, if in doubt, ask a doctor.
When a chart is worth asking about
Based on the guidance summarised above, it is reasonable to raise a child's growth with a paediatrician or family doctor if:
- the child seems much shorter, or much taller, than other children of the same age and sex;
- their growth seems to have slowed down, or stopped, over several measurements;
- their line on the chart drops or climbs steeply across several percentile lines;
- puberty seems to be starting much earlier, or much later, than in other children.
The guide on when to talk to a doctor describes what an assessment can involve. Often the answer is that a child is growing normally for their family: MedlinePlus and the NHS both note that many children are short simply because their parents are. When there is a medical cause, finding it early gives the most options.
Next: Height myths checked: stretching, hanging, pills and insoles